Discover the power of real-time Nginx monitoring with NGINX Plus, streamline configurations, manage upstream servers, and optimize traffic analysis.
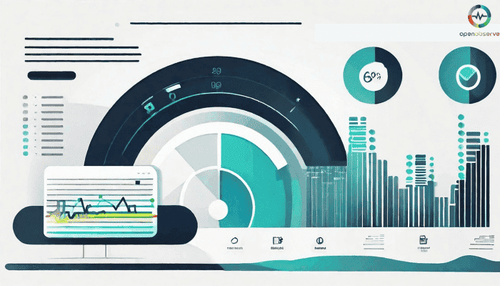
Discover the importance of unified observability and troubleshooting for cloud-based applications using observability dashboards.
Learn how to use 'kubectl logs -f -c' for real-time log streaming and manage Kubernetes logs efficiently.
Explore the importance of open source solutions in enhancing data observability compared to vendor-managed counterparts.
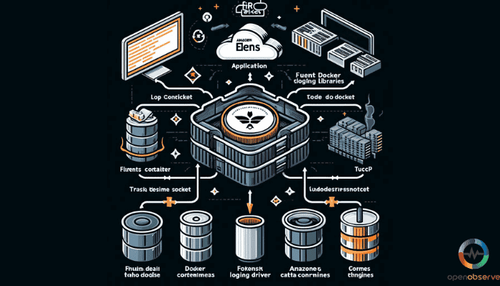
FireLens is a log router for Amazon ECS that offers direct streaming to destinations like Amazon CloudWatch and simplifies log filtering.
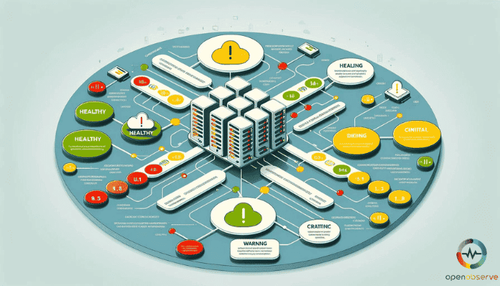
Elasticsearch cluster health is significant. It has 3 status colors: green, yellow, red, depicting shard allocation.
Cloud scalability offers cost efficiency, improved performance, enhanced reliability, and robust disaster recovery essential for organizational growth.
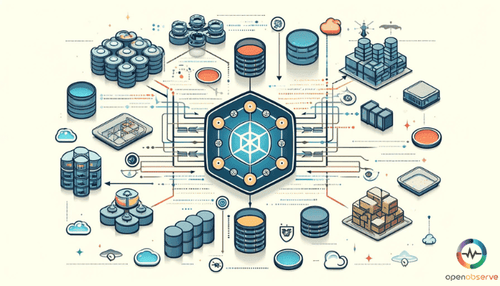
An observability pipeline manages, optimizes, and analyzes telemetry data, enhancing security and operational efficiency with AI-driven enhancements.
Explore key Kafka monitoring metrics, tools and best practices from industry experts for optimized performance and seamless data streaming.
Learn about the pull-based model for metrics collection pivotal to Prometheus architecture and its components like Server, Exporters, Alertmanager.
Explore the difference between monitoring and observability and learn how they work together to optimize system performance and reliability.
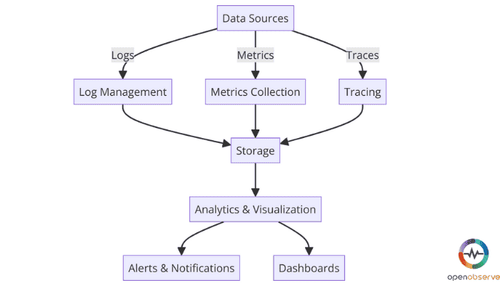
Through logs, metrics, and traces, microservices observability manages the complexities of architecture for reliable, high-performance applications.
Uncover top open source logging tools of 2024, with a focus on flexibility, cost-effectiveness, comprehensive features, and support.
The blog discusses the observability stack, its core pillars and the importance of telemetry data in system performance.
Learn how to optimize asset performance using Prometheus and OpenObserve for real-time monitoring and dynamic dashboard visualization
Prometheus vs Grafana: Learn how both of these tools compare in crucial metrics like features, data collection and storage, UI, and more.