Get started with Jaeger receiver by enabling supported protocols and endpoints, and managing Elasticsearch backend configuration.
Learn how security observability enhances understanding and incident detection, contributing to robust threat protection in cybersecurity.
Master Apache Monitoring setup, elevate performance metrics, and customize your server with the right tools and practices.
Deploy and configure your Kubelet Stats Receiver with OpenTelemetry using this step-by-step guide.
Discover the role and setup of SQL Server Receiver within OpenTelemetry for effective monitoring and performance optimization.
Discover ways to choose the right web application monitoring tools, monitor user experience, and automate alerts for maximum efficiency.
Explore how JavaScript opentelemetry enhances monitoring, tracking, and optimizing application performance in full-stack applications.
Learn about developing an observability strategy, identifying key goals, determining relevant data, and selecting suitable tools and technologies.
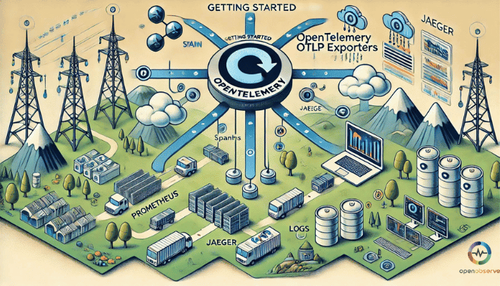
Start with OpenTelemetry OTLP Exporters; an overview, benefits of using them in telemetry, and their importance.
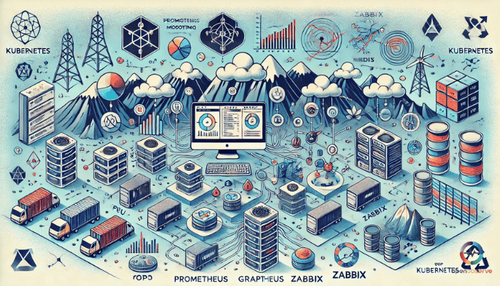
Prometheus is an open-source monitoring tool offering seamless integration with Kubernetes and Grafana for multidimensional data model.
Learn the essential steps to enable istio tracing in microservices and how Istio’s Envoy proxy generates and propagates tracing headers.
Explore how log analysis improves efficiency and enhances security, with an introduction to popular tools like Splunk and ELK Stack.
Learn how to configure Kafka to report metrics to the OpenTelemetry Collector in our in-depth guide for Kafka metrics receiver.
Understand how to use OpenTelemetry to collect and forward Windows Event Log Receiver, specifying log channels for optimal monitoring.
Dynatrace works by automatically monitoring applications and infrastructure, tracking transactions from browser to database, and examining performance issues.
Elastic storage pertains to data security, scalability, cost efficiency, and enhances organizational flexibility in data use.
This blog tells about Journald Receiver, its role in centralized log management, and its compatibility with log distributions.
Metrics is a numeric representation of data over time, providing essential insight into system performance within observability.
The synergy between Fluentd and Kubernetes enables enhanced monitoring and efficient management of containerized workloads.
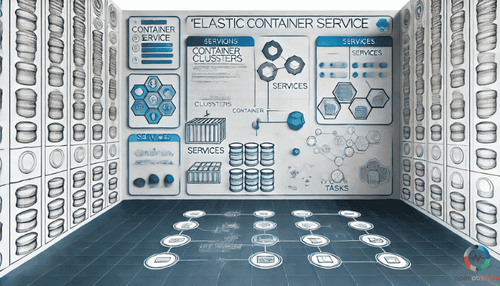
Explore ecs documentation, understanding its key concepts like Tasks, Services, Clusters, and deploying containerized applications efficiently.
Dive into the essentials of microservices monitoring tools, covering prominence of observability, alert balance and performance identification.