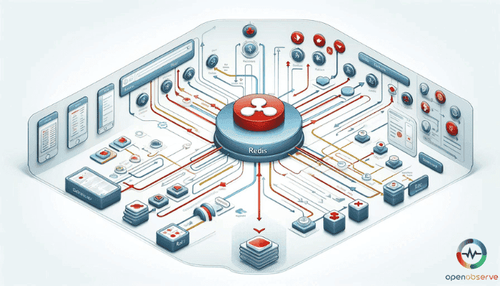
The blog discusses otel-collector redis receiver's deployment, configuration, and metrics, such as memory used and commands processed for enhanced monitoring.
Discover key steps in choosing the right SaaS monitoring tools: consider type of application, performance requirements, and user experience.
Explore the top open source Splunk alternatives like OpenObserve, SigNoz and Logstash. Compare to find the best fit for your observability needs.
Get an overview of SPA Monitoring, its importance in monitoring single page applications, and its eminent advantages for developers.
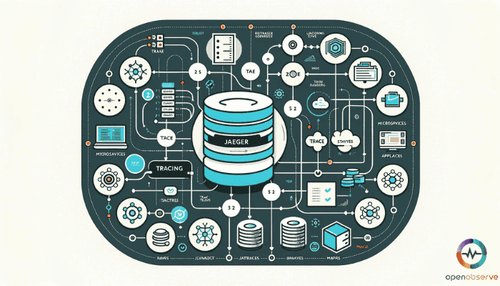
Get started with Jaeger tracing: understand its role in distributed systems and explore the Jaeger UI for better monitoring.
Discover Elasticsearch Match Query's capabilities handling text, numbers, dates, and boolean values for precise and fuzzy searches.
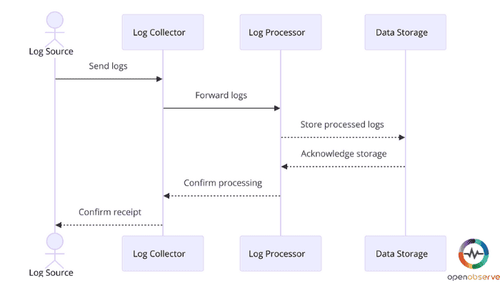
Learn the importance of log ingestion in monitoring and security, handling different types like security, system, and application logs.
RUM captures user interaction metrics for proactive issue resolution and digital performance improvement. Understand Real User Monitoring.
Explore the three pillars of observability—logs, metrics, and traces. Learn how they interact to provide deep system visibility and drive performance.
This blog introduces the OpenTelemetry Collector for Memcached and details the data collection process for effective Memcached monitoring.
Unravel the four core Prometheus metric types - Counter, Gauge, Histogram, Summary - their role in system monitoring.
Harness the power of Elasticsearch on Azure with our comprehensive deployment guide. Learn to set up, manage, and optimize your cluster for real-time search and analytics.
Discover top web performance monitoring tools like OpenObserve, Sematext, Pingdom, and Uptime Robot, balancing frequency, coverage, and pricing models.
The blog discusses building an open source observability platform, highlighting key tools like Prometheus, Loki, and OpenTelemetry.
Our Splunk search tutorial provides step-by-step instructions on creating search queries, refining searches with Boolean operators.
Explore IIS Logging, understand its unique role in troubleshooting and optimizing web services, and learn how to configure log file locations.
Explore the operational frameworks of OTLP, how it contributes to OpenTelemetry data models, and its evolving nature within the OpenTelemetry project.
Overview of the role of open source log management and monitoring for system health. Key tools for 2024 include Graylog, Logstash.
Unveil the role and benefits of JavaScript Logging in web development and Agile methods, highlighting the distinction in client-server logging tactics.
Learn about open source APM tools, their key features, benefits, and how they compare to commercial APM solutions.
Explore the benefits and components of Syslog servers, how they work, and the importance of log management for system diagnostics.